Neostox Trading Reports
Trading Reports & Performance Analysis.
It is easy to remember your best trade. It is also easy to remember the trade that hurt. But what about everything in between?
How often are you winning? How much margin are you using? How much are fees and taxes costing you? Are your good days actually consistent — or are a few trades carrying the entire result? Neostox Trading Reports helps you look beyond individual trades and understand how you are actually trading over time.
Trade. Review. Understand. Practice again.
View Your Trading ReportsAll P&L, margin and performance figures in Neostox Trading Reports relate to simulated trading with virtual money.

- P&L
- Win Rate
- Margin Used
- Fees / Taxes
- Today
- Last 30 Days
Your Final Balance Doesn’t Tell the Whole Story.
Suppose two traders both finish the month with the same virtual profit. That does not mean they traded the same way.
Trader A
- Small Win
- Small Loss
- Small Win
- Small Win
- Controlled Loss
Final Result: +₹X
Trader B
- Large Loss
- Large Loss
- Oversized Win
- Large Win
Final Result: +₹X
Illustrative example only.
Same Final P&L. Very Different Trading Behavior.
The Big Picture
How Are You Trading — Today and Over the Last 30 Days?
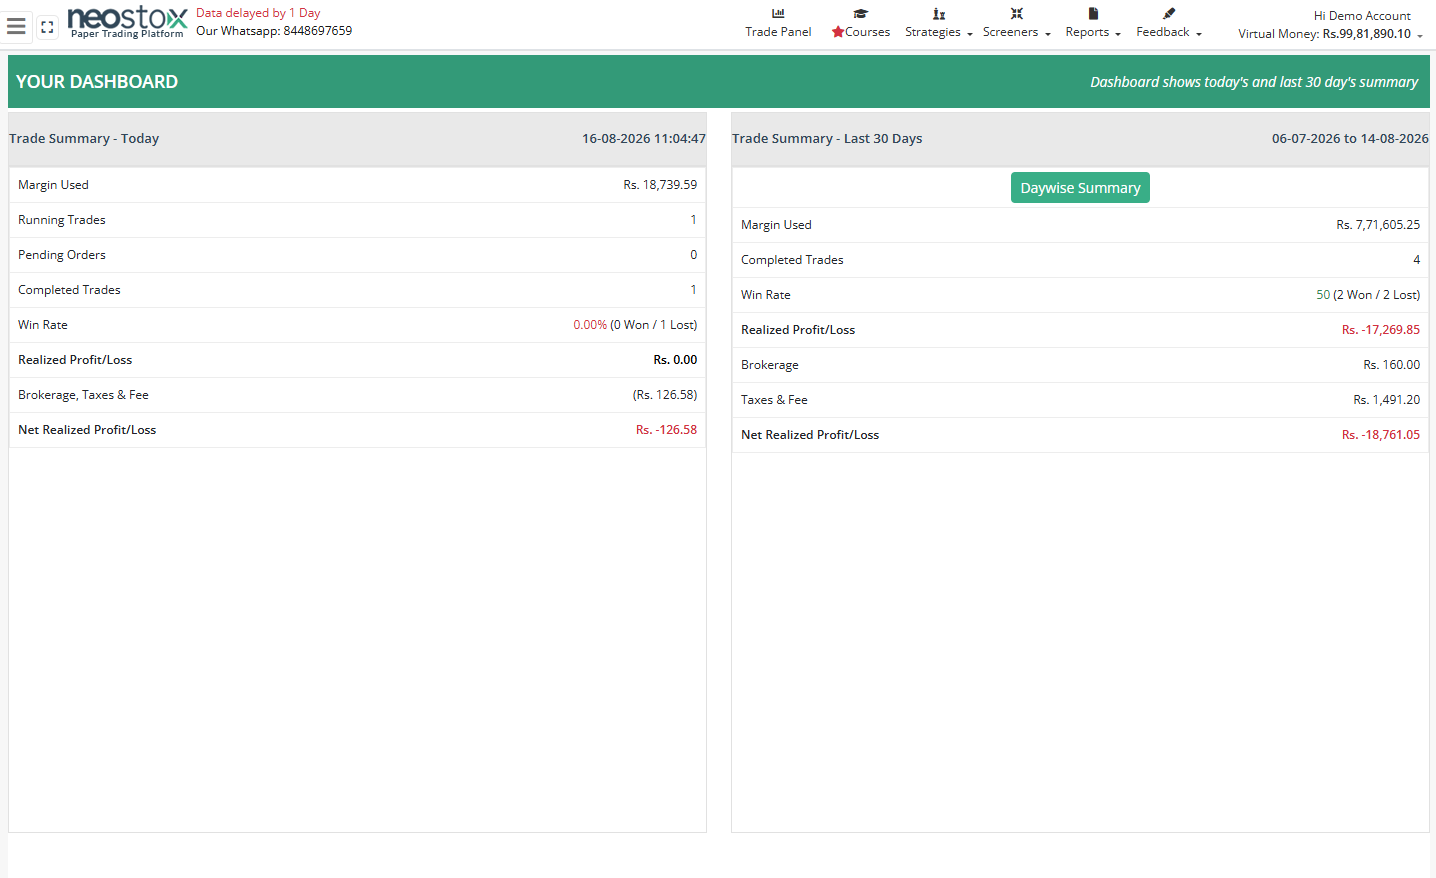
The Margin Dashboard gives you a quick view of your recent trading performance. Instead of opening individual trades, you can immediately see some of the numbers that matter most.
- P&LSee the profit or loss from your virtual trading.
- Win RateUnderstand what percentage of your trades are ending in profit.
- Margin UsedSee how much trading margin you are using.
- Fees & TaxesUnderstand how transaction costs are affecting your overall result.
- Today vs Last 30 DaysCompare today’s performance with a broader 30-day view.
One good day can feel great. Thirty days tells you much more.
- P&L
- Win Rate
- Margin Used
- Fees / Taxes
- Today / 30 Days
See the Pattern Across Your Trading Days
Was It a Good Month — or Just Two Good Days?
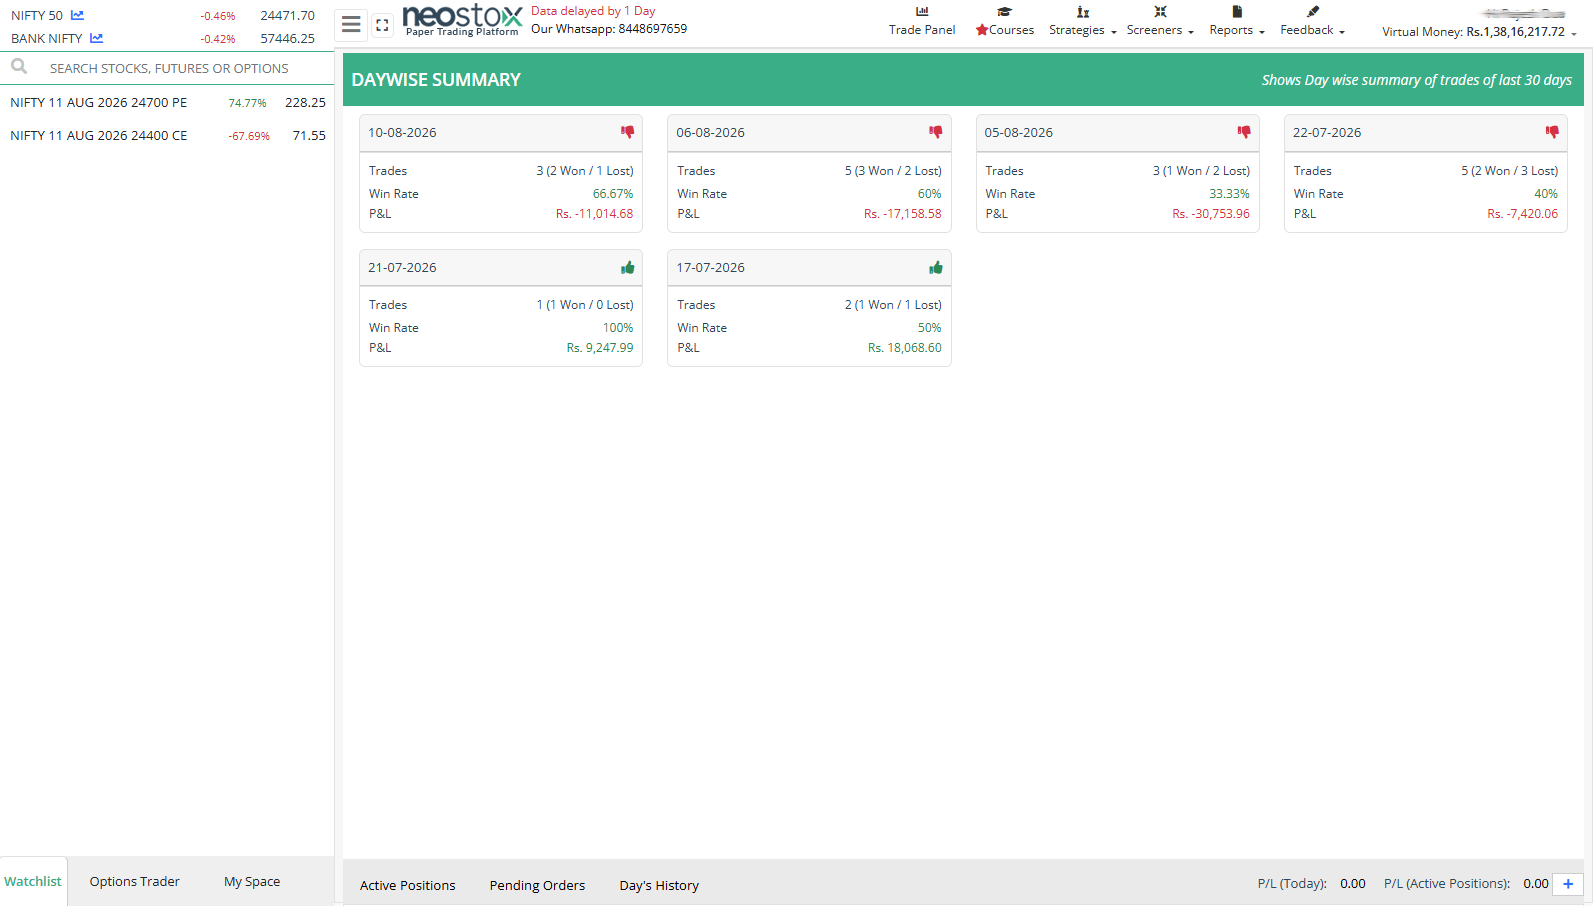
A monthly result can hide what happened on individual trading days. The Day Wise Summary lets you go back day by day and see how you performed whenever you traded.
- Margin Used — how much trading capital was being used that day
- P&L — how the day’s virtual trades ended overall
- Win Rate — how many trades worked compared with those that did not
Sometimes the pattern you need to find is not on the chart. It is in your own trading.
- Do I perform better on some days than others?
- Are my losing days much larger than my winning days?
- Am I using more margin on the days when I lose heavily?
- Was the month genuinely consistent — or did one day change everything?
When You Want to Go Deeper
Sometimes You Need to Look at the Actual Trades.
The dashboard tells you how you are doing. The Day Wise Summary tells you when it happened. The Detailed Trading Report helps you understand what actually happened trade by trade.
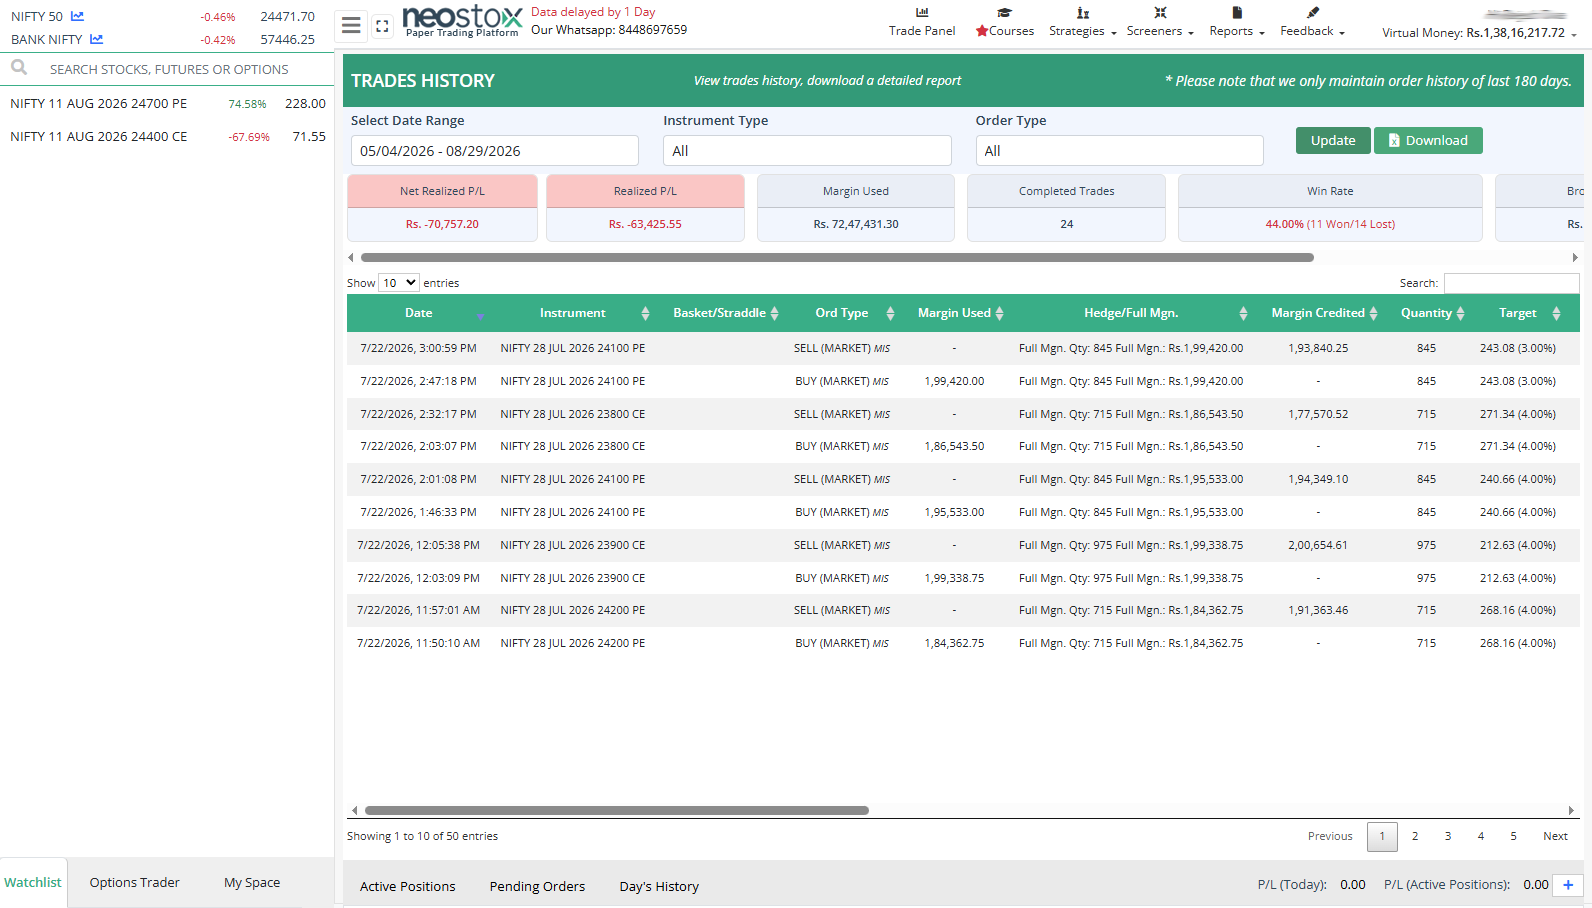
Select the date range you want to study and go through the detailed information related to the trades you took during that period.
- A Bad Trading Day — see which trades contributed to the loss
- An Unusually Good Day — was it consistent execution or one exceptional trade?
- Repeated Mistakes — behaviors that keep appearing
- Trading Costs — fees and taxes on your activity
- A Longer Period — study a week or month instead of relying on memory
- Date range
- Trade details
- P&L
- Fees / Taxes
- Download to Excel
Start With the Big Picture. Go Deeper When You Need To.
- 1 Margin Dashboard How am I doing overall? Today + Last 30 Days · P&L · Win Rate · Margin · Fees & Taxes
- 2 Day Wise Summary What happened on each trading day? Day-by-day view · Margin · P&L · Win Rate
- 3 Detailed Trading Report What actually happened in my trades? Selected date range · Trade details · Costs · Excel download
Overview → Day → Trade. Go only as deep as you need to understand what happened.
Don’t Open a Report Just to See Whether You Made Money.
Your P&L matters. But if that is the only number you look at, you may miss the more useful lessons.
- Am I Consistent? Or is most of my result coming from one or two trades?
- Am I Using Too Much Margin? Does my position size increase when I become confident or emotional?
- Are My Losses Too Large? A high win rate means little if a few losing trades wipe out many winners.
- What Are Fees and Taxes Doing to My Result? Frequent trading has a cost.
- Do the Same Mistakes Keep Appearing? If the same behavior keeps showing up, the report is telling you something worth noticing.
The report gives you the numbers. The important part is what you learn from them.
Quick FAQ
Trading Report Questions
Your Trades Have Already Happened. Don’t Waste the Information.
Look Back Before You Trade Again.
See the result. Understand how you got there. Find what needs work. Then go back and practice it again.
Start 3-Day Free Trial