Neostox Advanced Charting System

See the Market More Clearly. Practise With Greater Purpose.

A trading chart should do more than display price movements.

The Neostox Advanced Charting System gives you the indicators, patterns, analytical tools and historical market practice you need to study the market in greater depth.

Analyse price action, discover developing setups, replay previous market sessions and practise your decisions using virtual money—all on one platform.

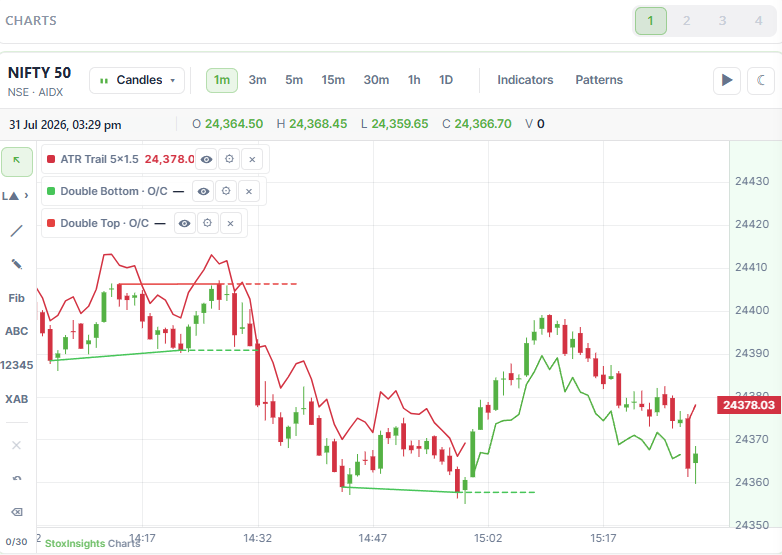
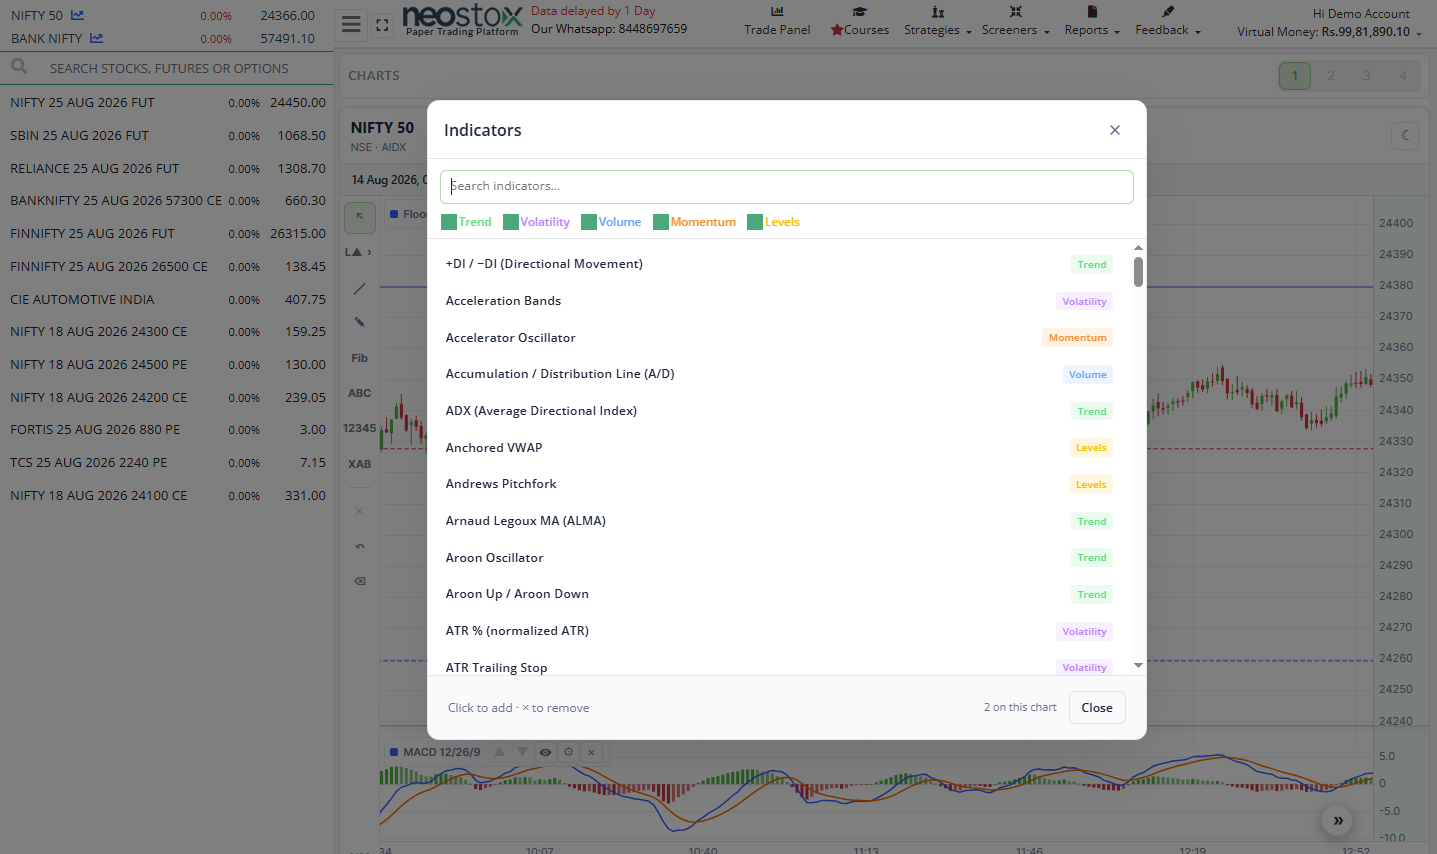
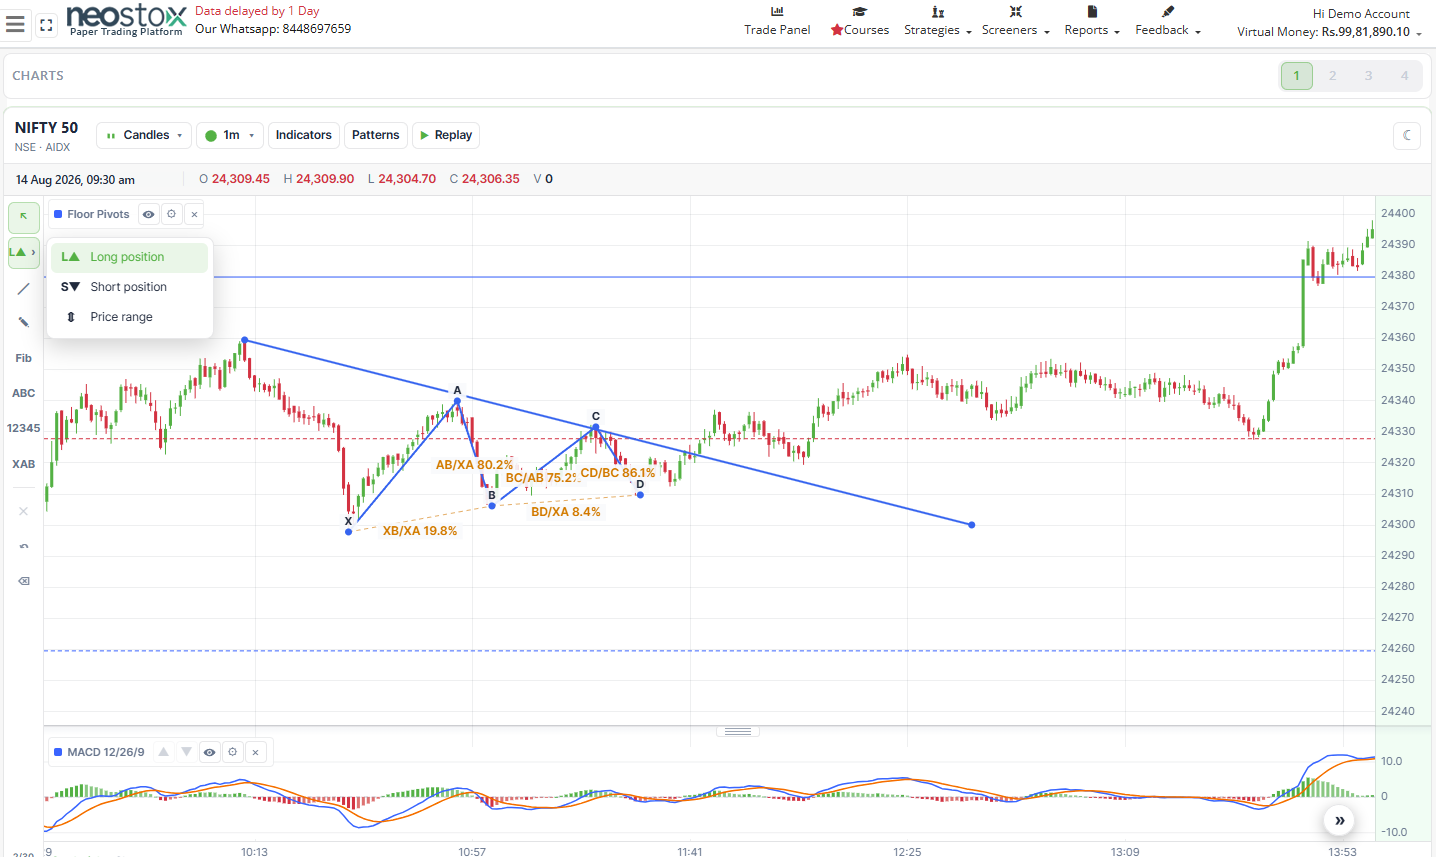
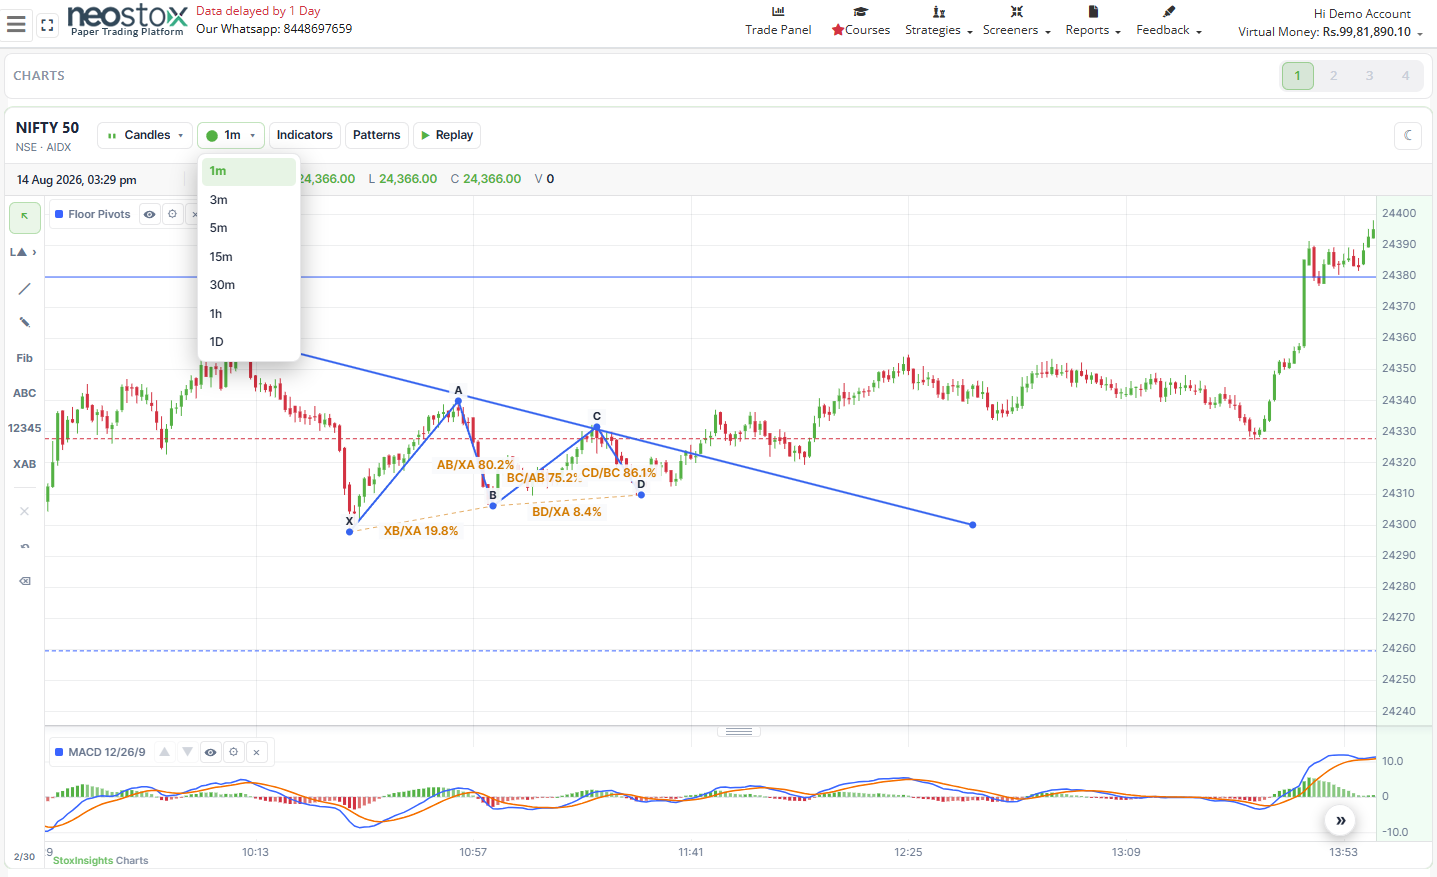
Neostox advanced charting system with technical indicators, drawing tools and historical bar replay for paper trading practice

More Than Just a Price Chart

Most traders look at a chart and immediately try to decide whether the market will move up or down.

Neostox helps you take a more structured approach.

Study the trend. Examine momentum. Analyse volume. Mark important price levels. Identify chart patterns. Replay previous market movements. Then practise your trading idea without risking real capital.

The charting system is designed to help you move from guessing to analysing—and from analysing to practising.

Everything You Need for Detailed Market Analysis

100+ Technical Indicators

Access more than 100 technical indicators covering trend, momentum, volatility, volume and market strength.

Use popular indicators such as moving averages, RSI, MACD and Bollinger Bands, along with several advanced indicators for deeper technical analysis.

You can combine indicators to study the market from different perspectives and build a chart setup that matches your trading approach.

18 Institutional-Style Chart Patterns

Important market structures are not always easy to identify manually.

Neostox helps you analyse the market using 18 institutional-style chart patterns designed to highlight meaningful price formations and developing trading setups.

These patterns can help you understand:

  • Where price may be consolidating
  • Where a breakout may be developing
  • Whether a trend is strengthening or weakening
  • Where demand or supply may be emerging
  • How price is behaving around important market levels

Patterns are analytical tools—not guaranteed predictions. They should be studied together with price action, volume, market context and risk management.

Advanced Drawing Tools

Mark and study important areas directly on the chart.

Use charting tools to draw:

  • Trend lines
  • Support and resistance levels
  • Price channels
  • Fibonacci levels
  • Consolidation zones
  • Breakout areas
  • Entry, target and stop-loss levels

Your chart becomes a working analysis space rather than just a visual representation of price.

Multiple Timeframes and Chart Views

A setup can look completely different across different timeframes.

Move between shorter and longer timeframes to understand immediate price movement as well as the broader market structure.

Use the chart view that best supports your analysis and trading style, whether you are studying intraday movement, swing setups or longer-term trends.

Replay the Market. Practise Without Seeing the Future.

Historical Bar Replay

Looking at a completed historical chart makes every trade appear easy. You can already see where the market moved, where the breakout occurred and where the trend ended.

Bar Replay removes that advantage.

Select a historical period and reveal the market candle by candle. At each stage, analyse the chart and decide what you would have done without knowing what happens next.

Use Bar Replay to practise:

  • Identifying trading setups
  • Planning entries
  • Placing stop-losses
  • Setting targets
  • Managing open trades
  • Avoiding premature entries
  • Responding to changing market conditions

It allows you to revisit different market situations and practise the same way you would have had to decide at that moment.

Why Bar Replay Matters

Trading knowledge cannot be developed by reading theory alone.

You must repeatedly observe market behaviour and make decisions under changing conditions.

Bar Replay helps you practise during your own time instead of waiting for a particular setup to appear in the market.

Replay trending markets, sideways markets, breakouts, reversals, volatile sessions and failed setups until you begin to understand how price behaves in different situations.

Move Seamlessly From Analysis to Practice

Neostox brings chart analysis and virtual trading together.

After studying a possible setup, you can practise the trade using virtual money and observe how your decision develops.

Plan your:

  • Entry price
  • Investment amount
  • Quantity
  • Target
  • Stop-loss
  • Overall trade risk

This allows you to test not only whether your analysis was correct, but also whether your trade was planned and managed properly.

Analyse Stocks, Futures and Options

Use the charting system to study different instruments available on Neostox.

Analyse the underlying stock or index, understand the broader trend and then practise your strategy in stocks, futures or options.

For options traders, studying the movement of the underlying index or stock can provide valuable context before selecting and practising an options trade.

Built for Beginners and Experienced Traders

For Beginners

Use charts to understand how price, volume, indicators and market structure work together.

Practise identifying trends, support, resistance, breakouts and reversals without placing real-money trades.

For Active Traders

Test entry methods, indicator combinations, stop-loss placement and trade-management rules across different market conditions.

For Strategy Developers

Replay previous market periods, study repeated setups and evaluate whether a strategy behaves consistently before considering its use with real capital.

Build Your Own Charting Workspace

Every trader studies the market differently.

Create a chart environment that supports your own process. Select the indicators you use, adjust the timeframe, apply drawing tools and organise the chart around the information that matters to you.

Instead of switching between separate analysis and practice platforms, use Neostox as one connected trading-learning environment.

Charts Help You Analyse. Practice Helps You Improve.

A powerful chart can provide information, but improvement comes from how you use that information.

Neostox gives you the tools to:

  1. Study the market
  2. Identify a possible setup
  3. Plan the trade
  4. Practise using virtual money
  5. Review the result
  6. Improve your process

The objective is not to predict every market movement. It is to develop a more structured, informed and disciplined approach to trading.

Start Exploring Neostox Advanced Charts

Analyse market movements with more than 100 technical indicators, discover institutional-style patterns, replay historical sessions and practise your strategies without risking real capital.

Neostox is an educational virtual trading platform. All funds, orders, profits and losses shown on the platform are virtual. Virtual trading results do not guarantee similar results in real-market trading.

Neostox, the real stocks, options and futures trading experience with virtual money.

With Neostox, you can try all your strategies and become more experienced trader without risking your money.

Live Market, Virtual Money

Discover risk-free trading with Neostox's virtual trading platform. Experience real market scenarios and hone your skills with our comprehensive paper trading tools. Read More..

Hedge Trading

Explore advanced hedge trading strategies on Neostox and master risk management. Learn and execute sophisticated hedging techniques with our comprehensive, real-time trading platform. Read More..

Advanced Basket Orders

Master complex strategies with Neostox's Advanced Basket Orders. Efficiently manage multiple securities in one order with our innovative trading platform. Read More..

Live Reports with Day Wise Summary

Enhance your trading decisions with Neostox's Live Trading Reports. Gain real-time insights and comprehensive analysis of your day-to-day trading performance. Read More..

Pre-built Options Strategies

Streamline your options trading with Neostox's Pre-Built Strategies, offering a range of automated, customizable approaches for all levels of traders. Read More..

Neo Screener

Unlock market insights with Neostox's NeoScreener, an AI-powered tool offering comprehensive analysis across equities, options, and futures. Read More..

Options Analyzer

Enhance your options trading with Neostox's Options Analyzer, offering predictive analytics and real-time data for strategic decision-making. Read More..

Options Chain

Unlock advanced trading strategies with Neostox’s Advanced Options Chain, featuring real-time data and market analysis for informed options trading. Read More..

Stocks Screener

Navigate the stock market with ease using Neostox's Stocks Screener, providing real-time insights on top gainers and losers for strategic trading. Read More..

Industry/Sector Screener

Unlock in-depth industry and sector trends with Neostox's Industry/Sector Screener. Make informed trades with our comprehensive, real-time market analysis tool. Read More..

Index Screener

Step into the realm of advanced market analysis with Neostox – where data, strategy, and market indices insights converge to enhance your trading experience. Read More..

AI Options Trader

Maximize your options trading with Neostox's AI Powered Options Trader, offering smart, AI-driven strategies and real-time decision support in just a few clicks. Read More..

Download the App for
Free Now